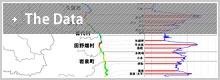
The Data
Updated Jun. 19. 2011
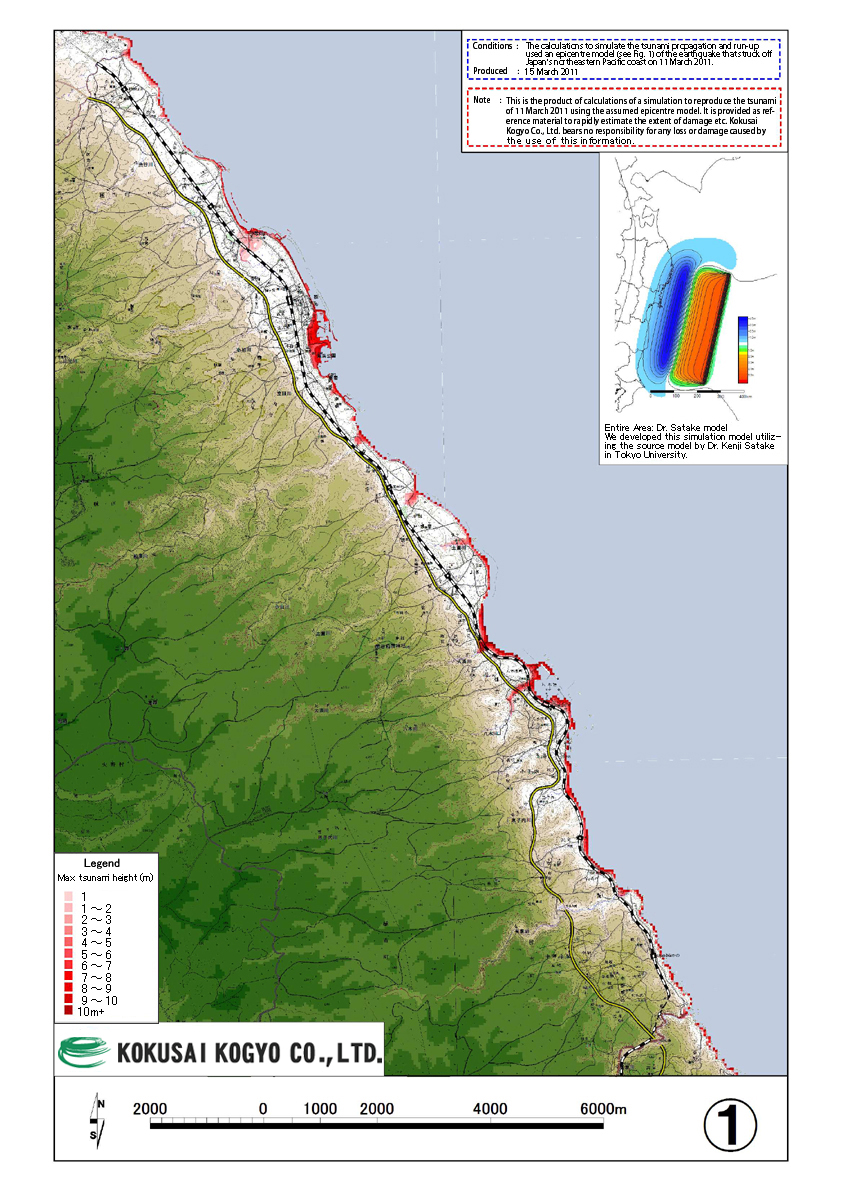
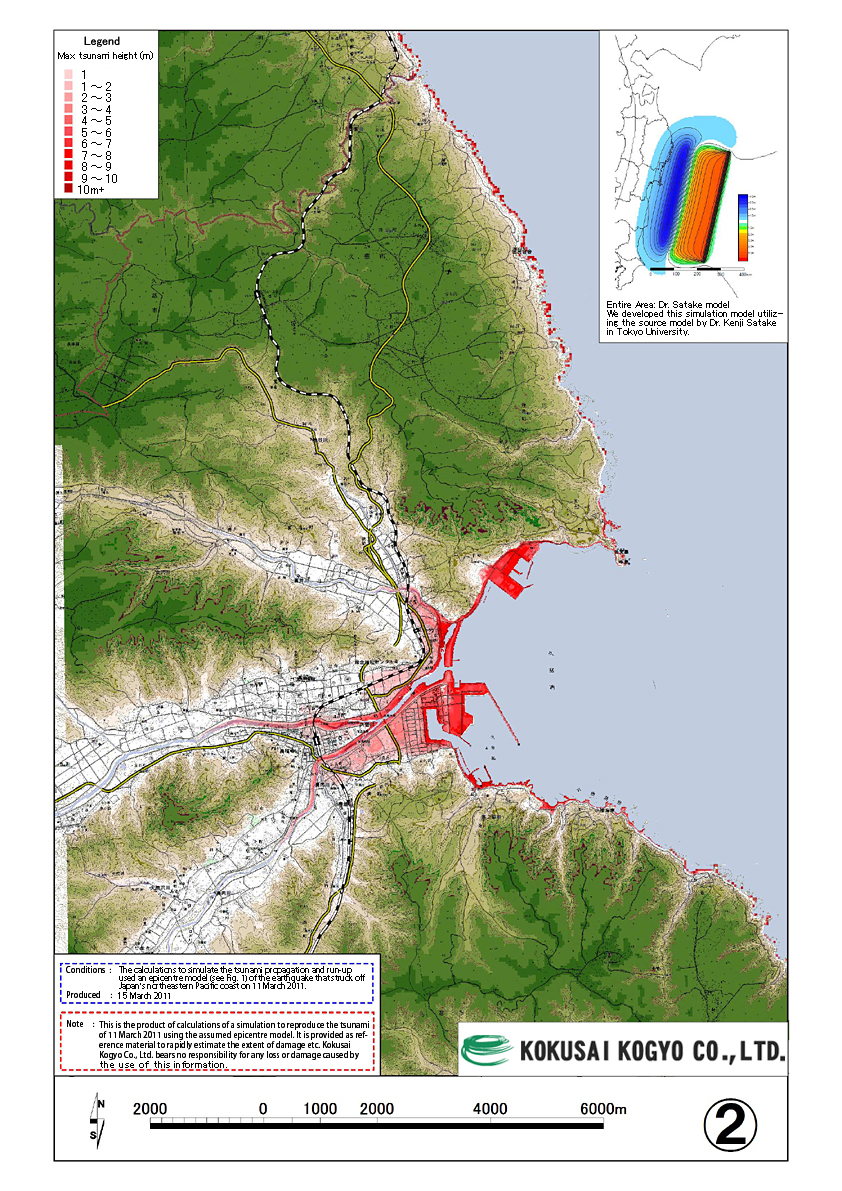
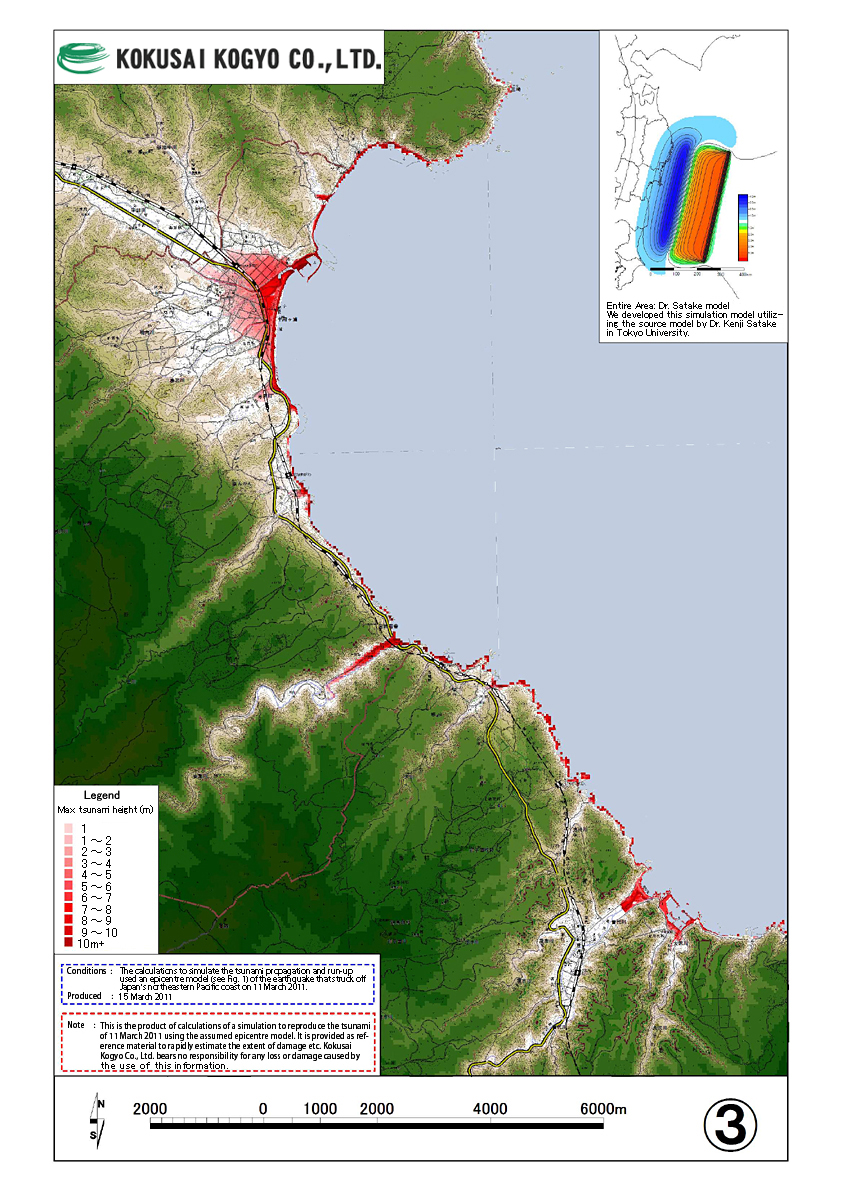
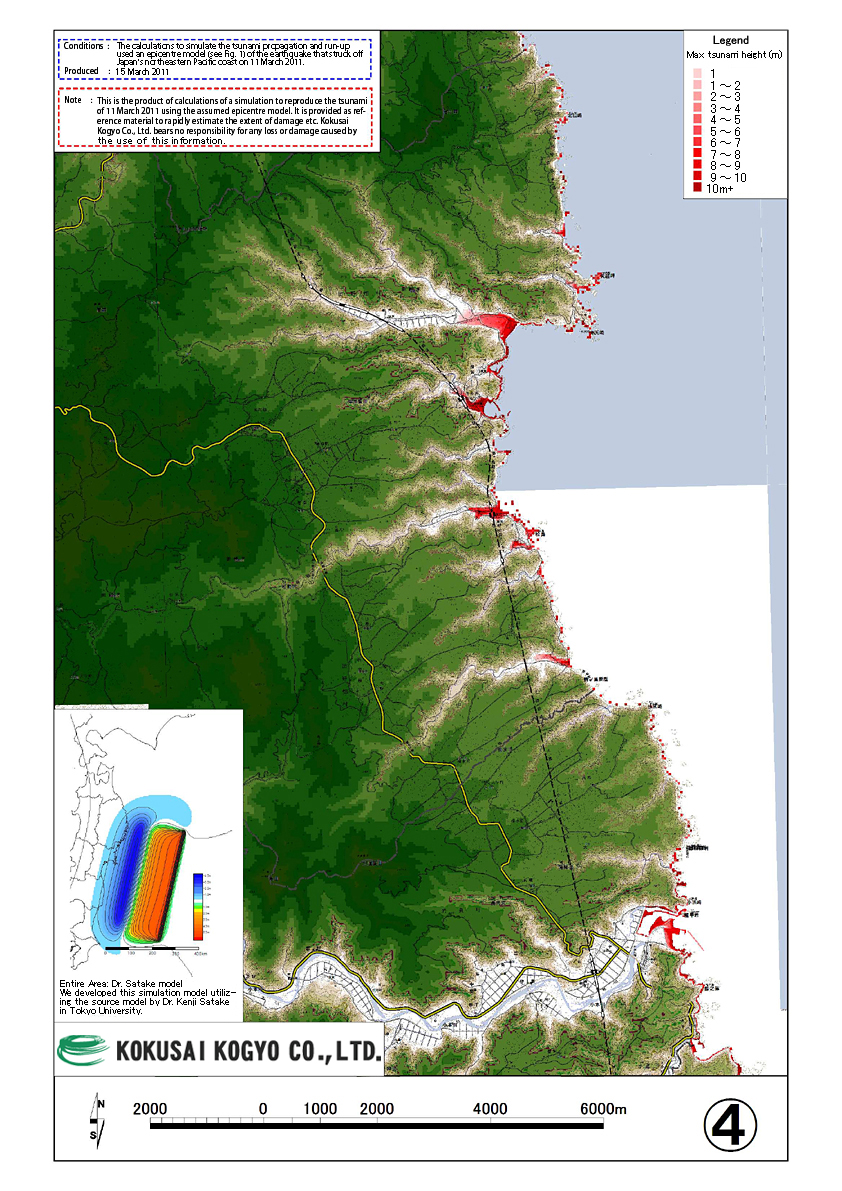
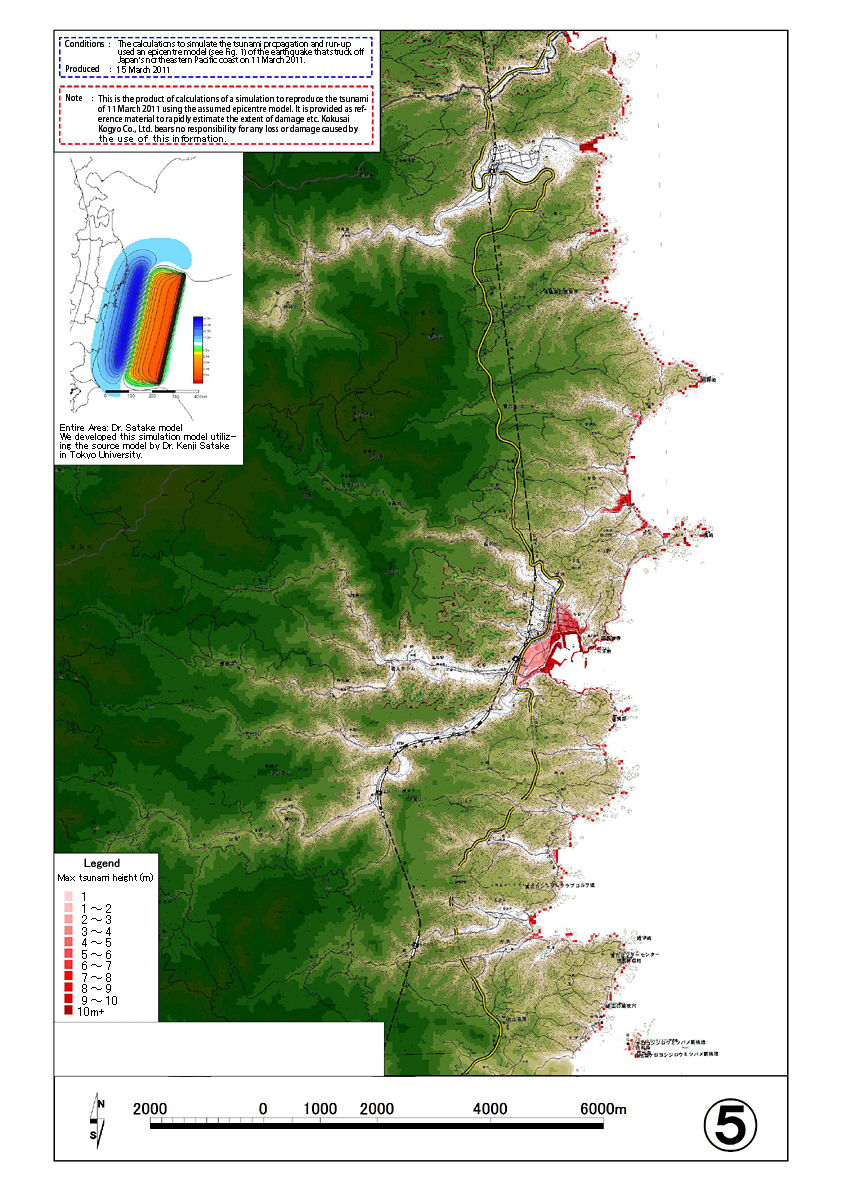
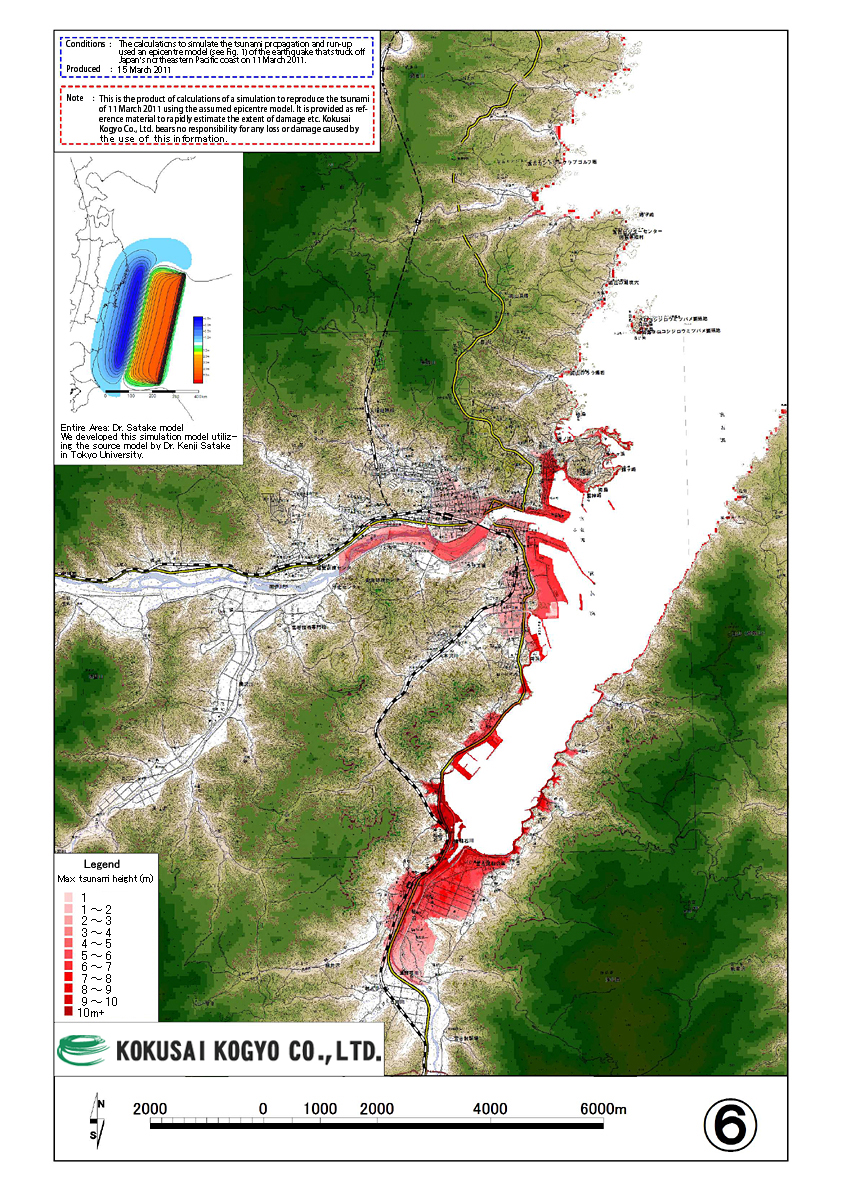
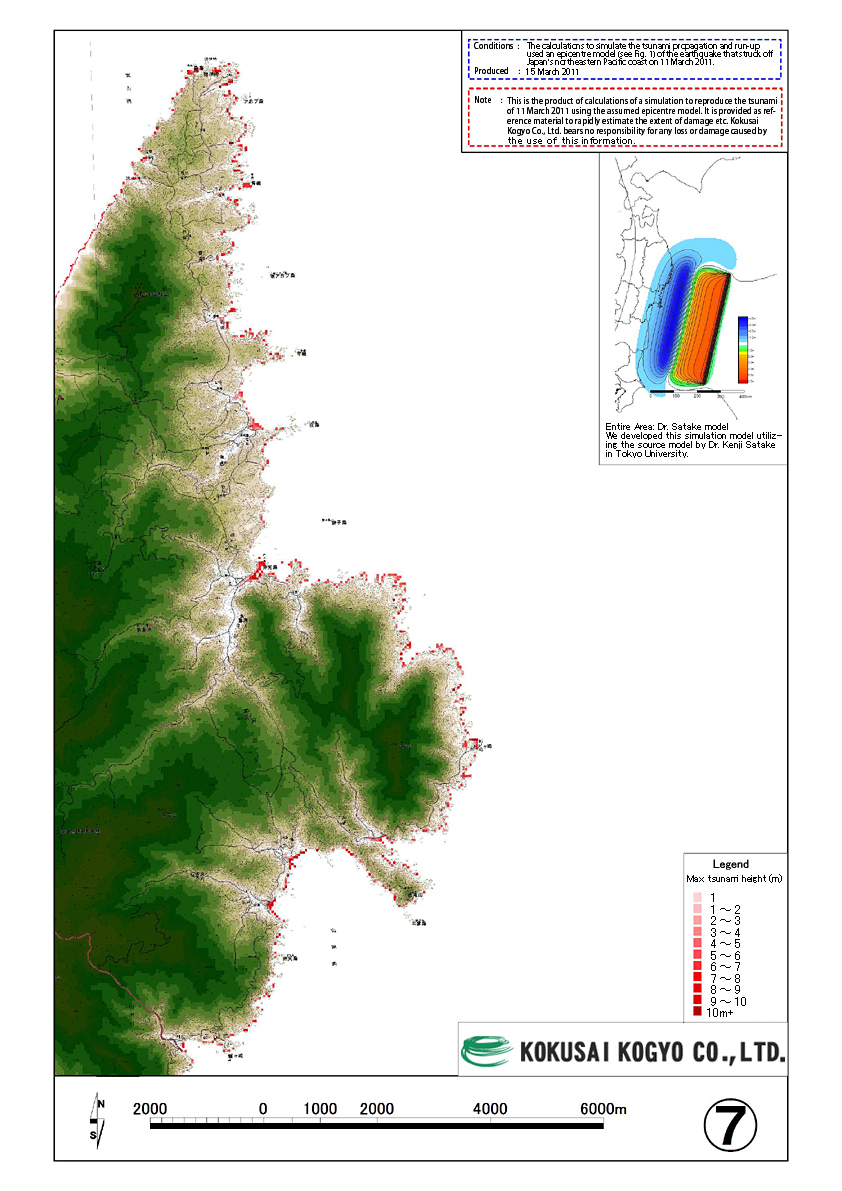
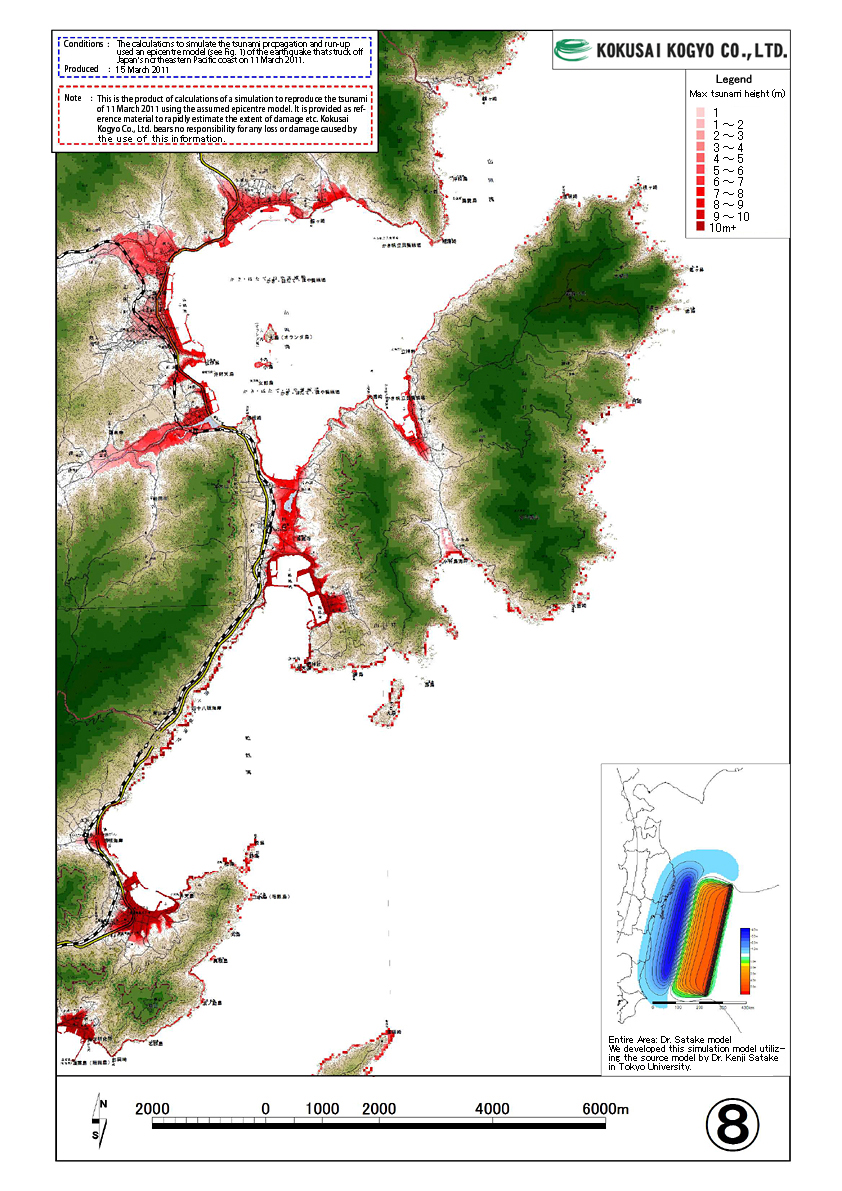
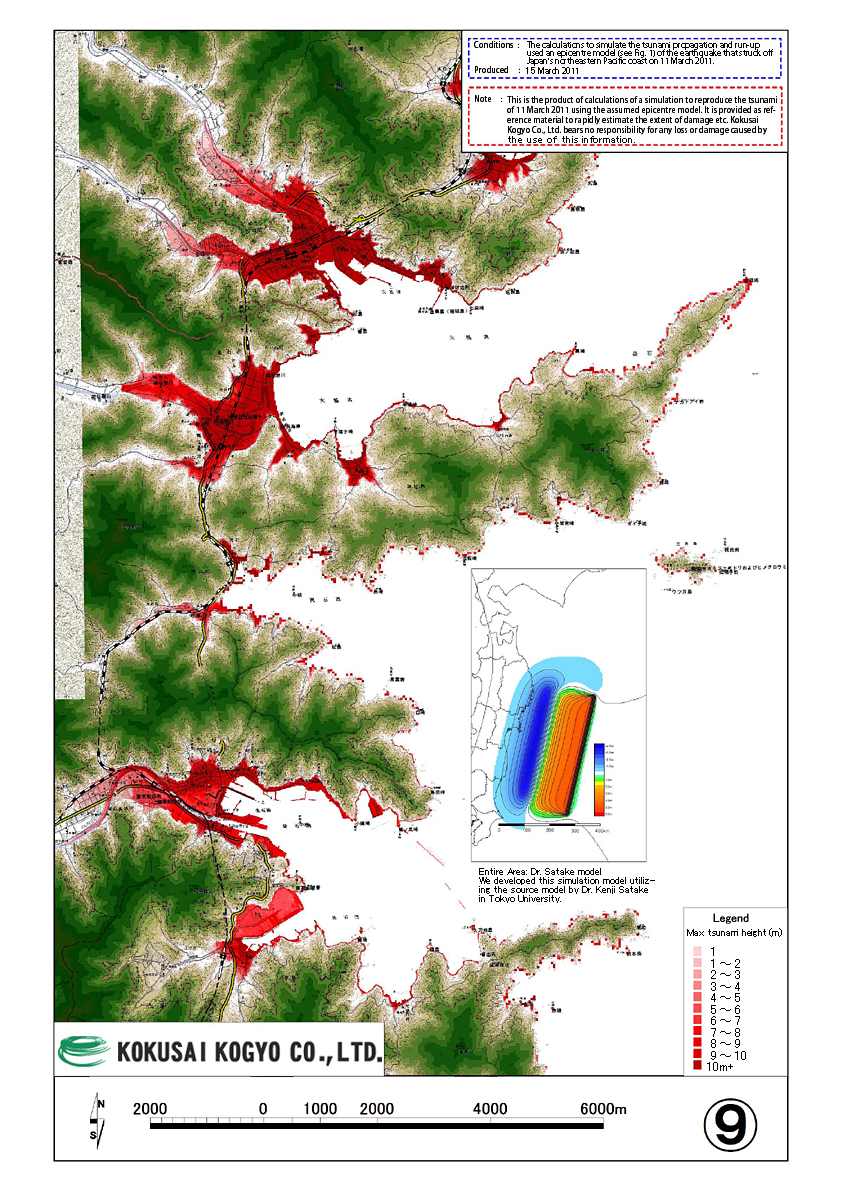
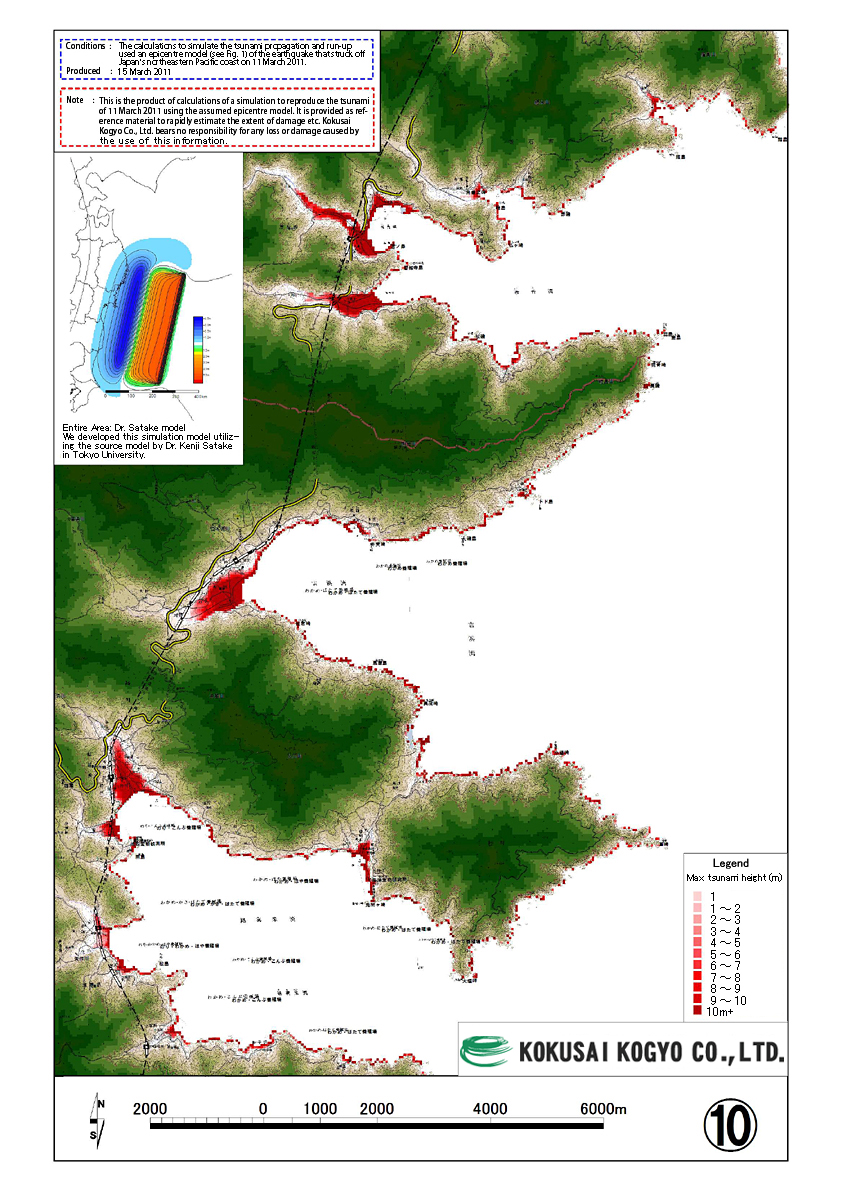
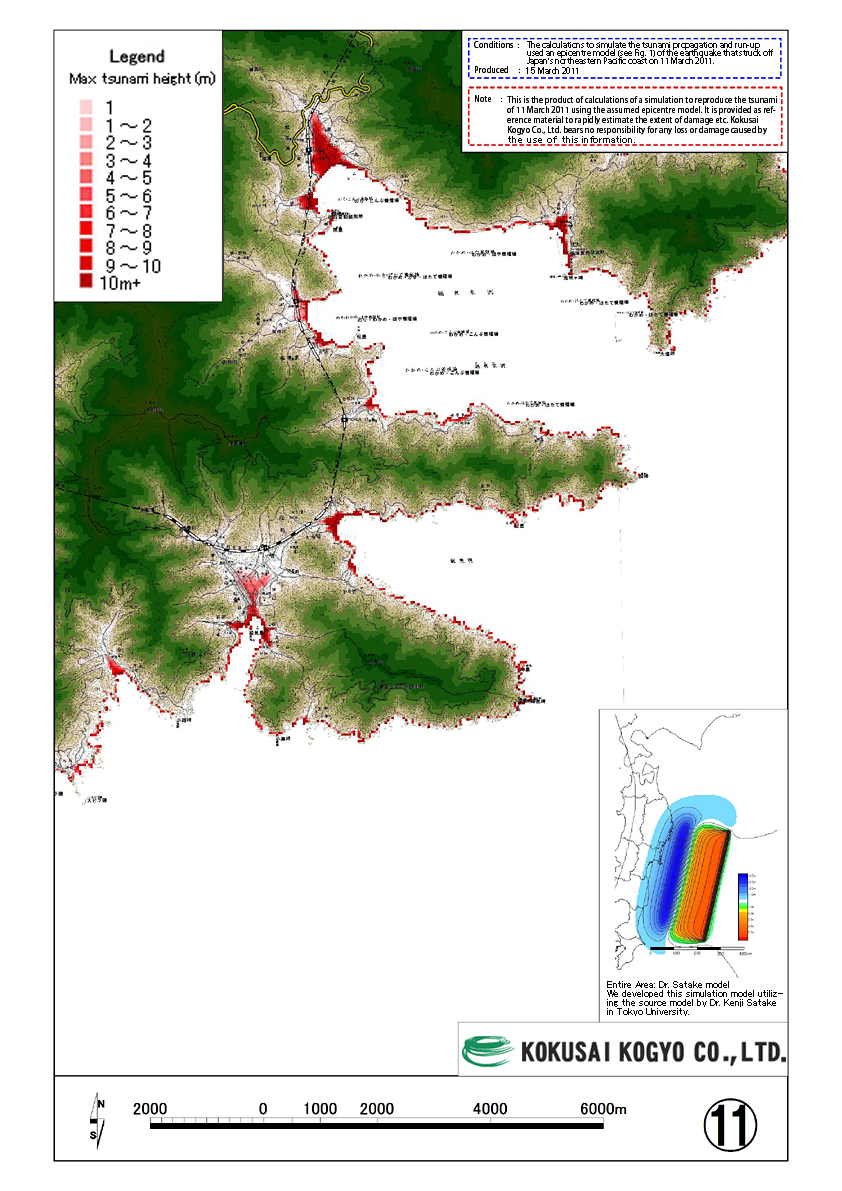
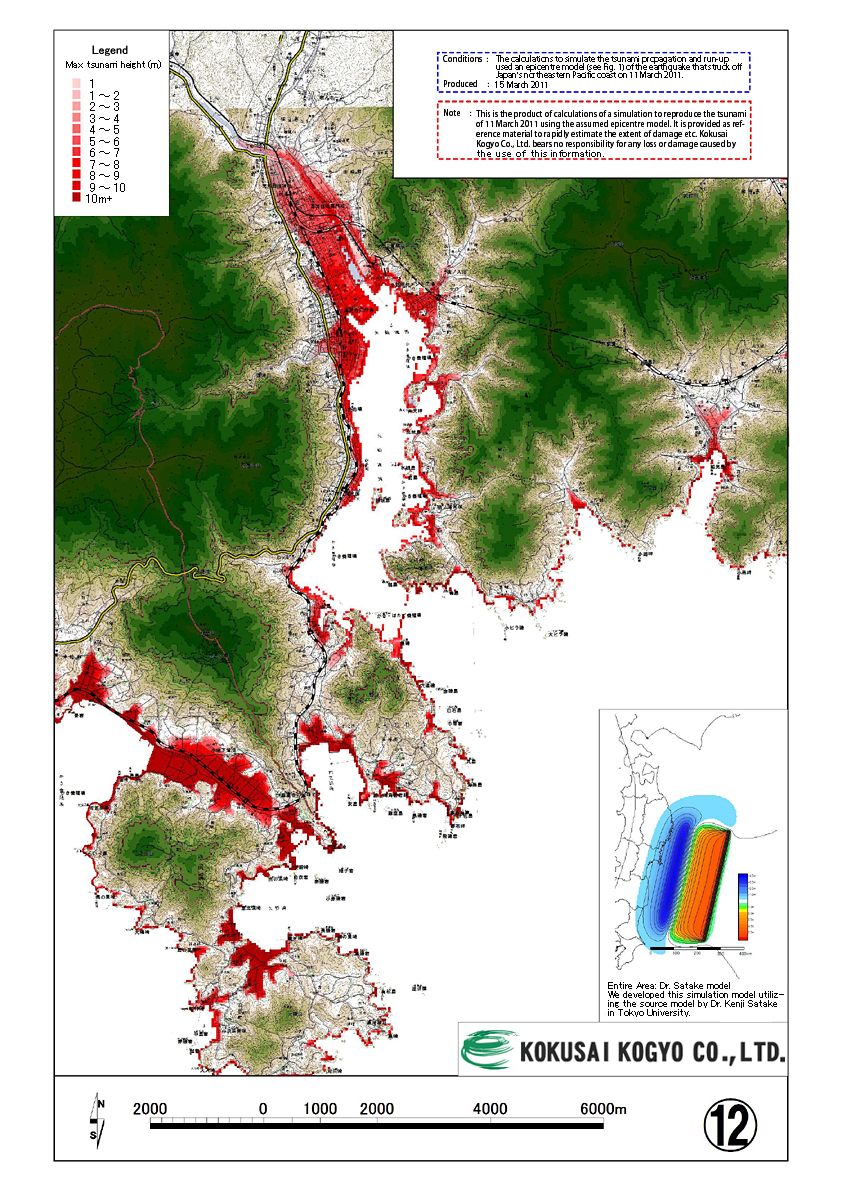
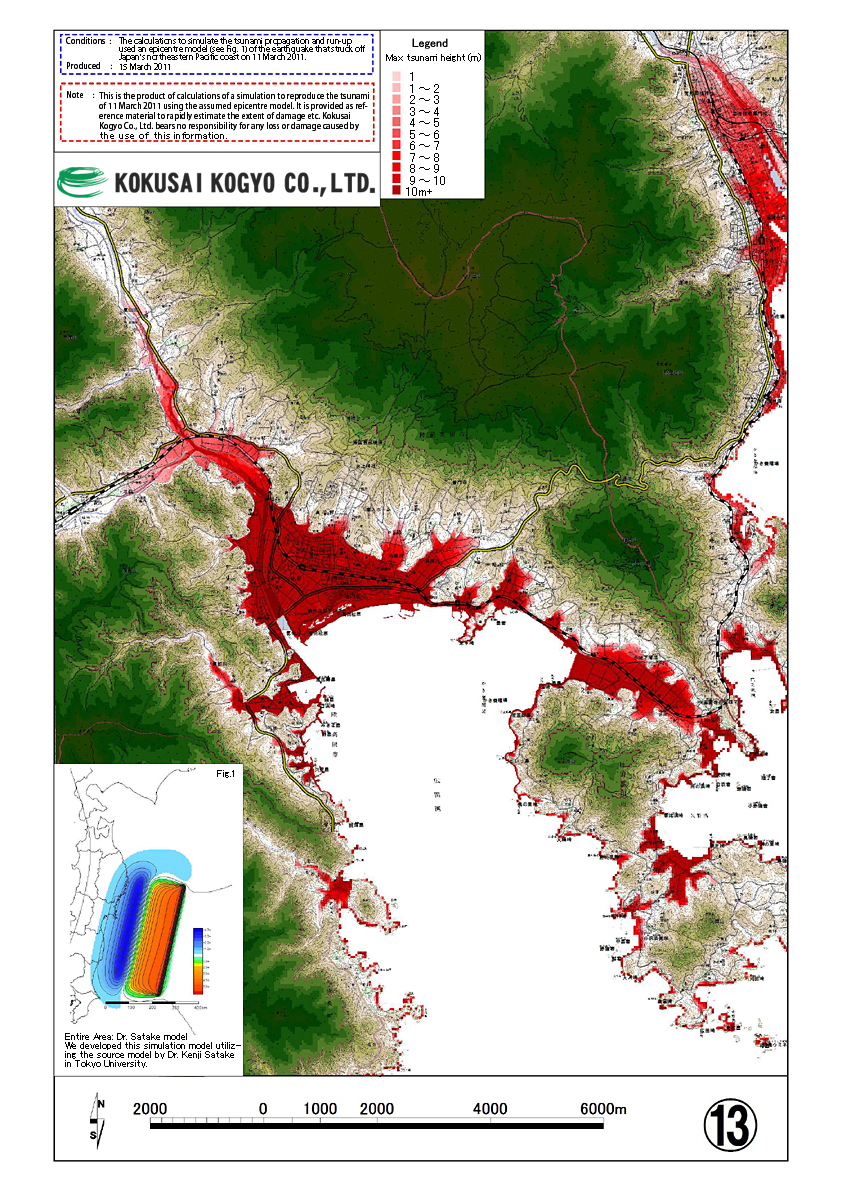
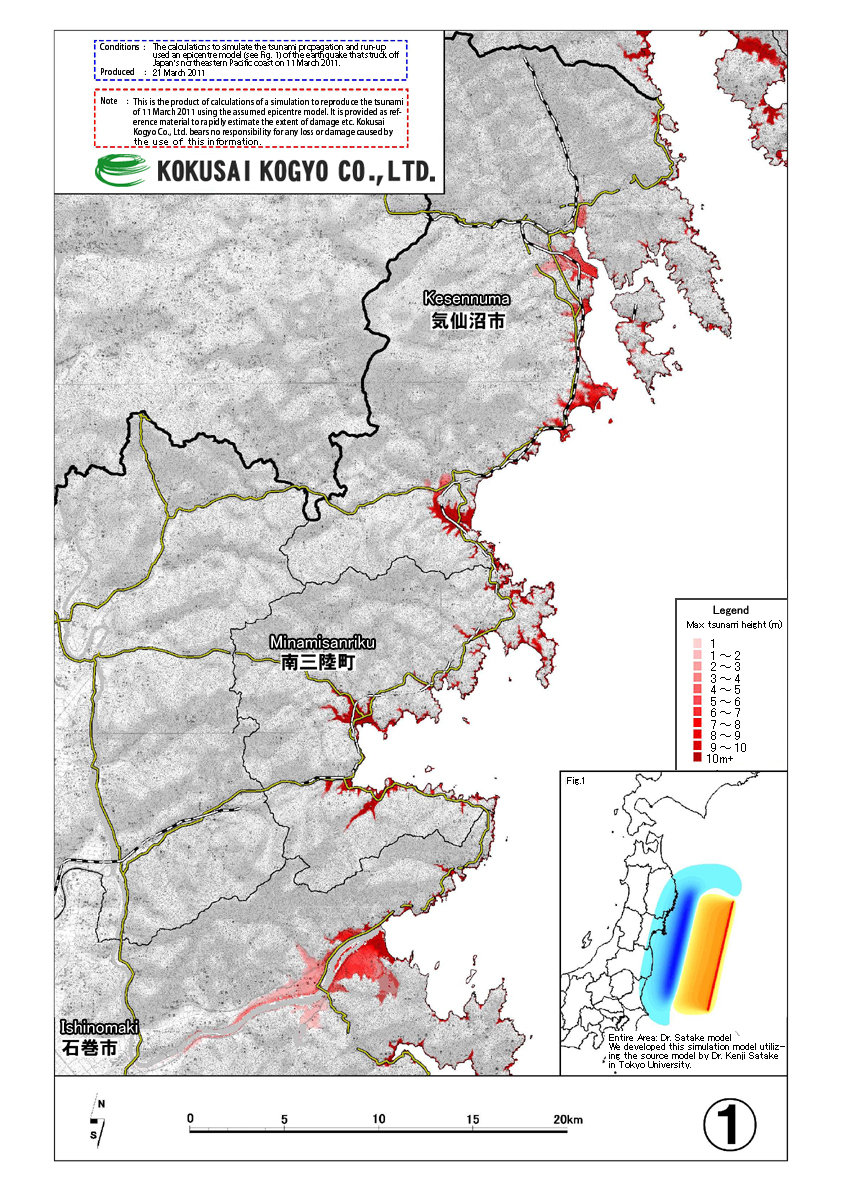
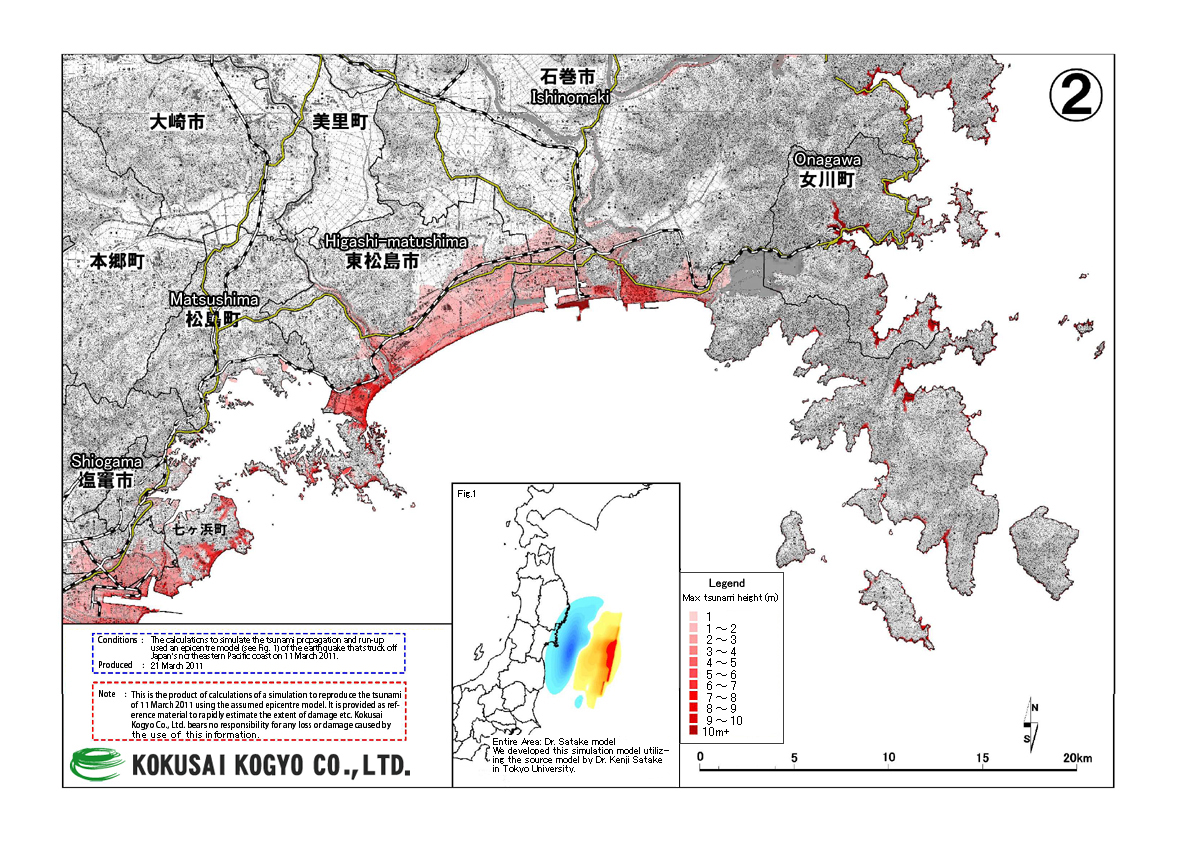
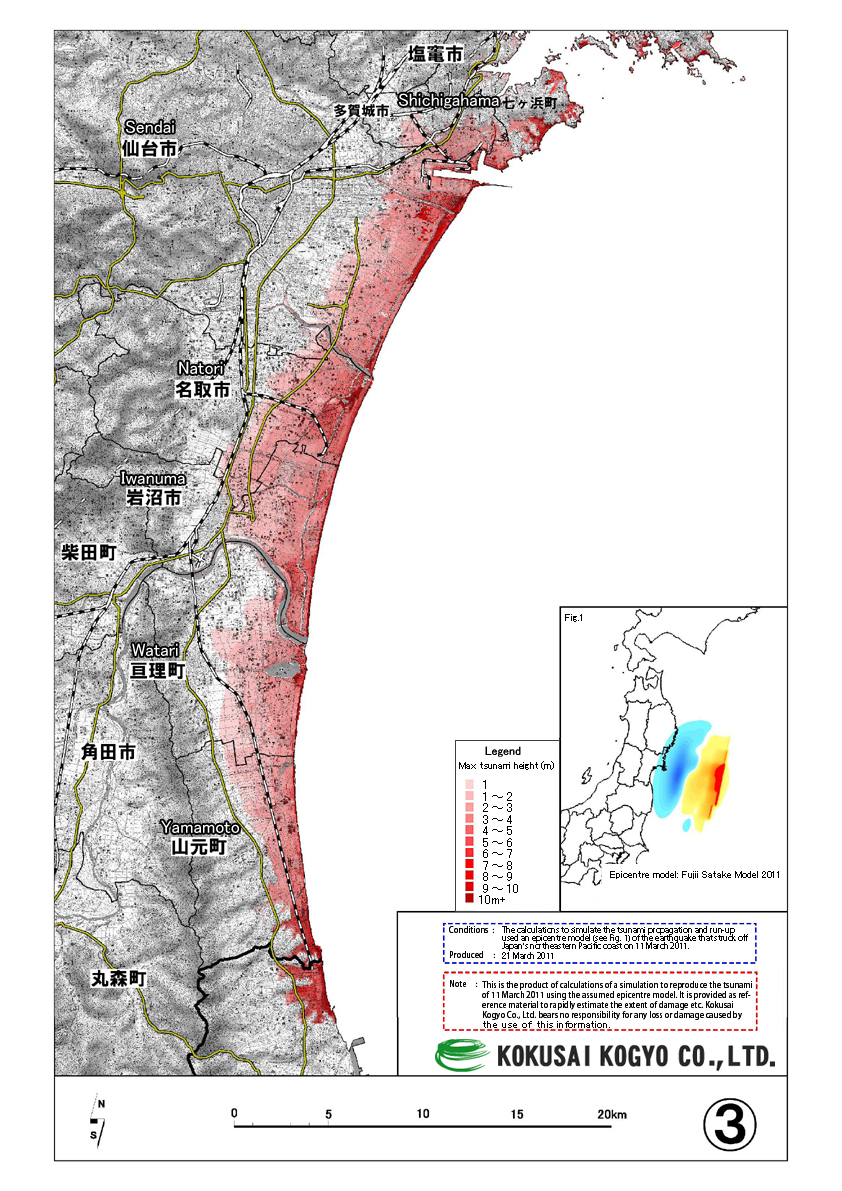
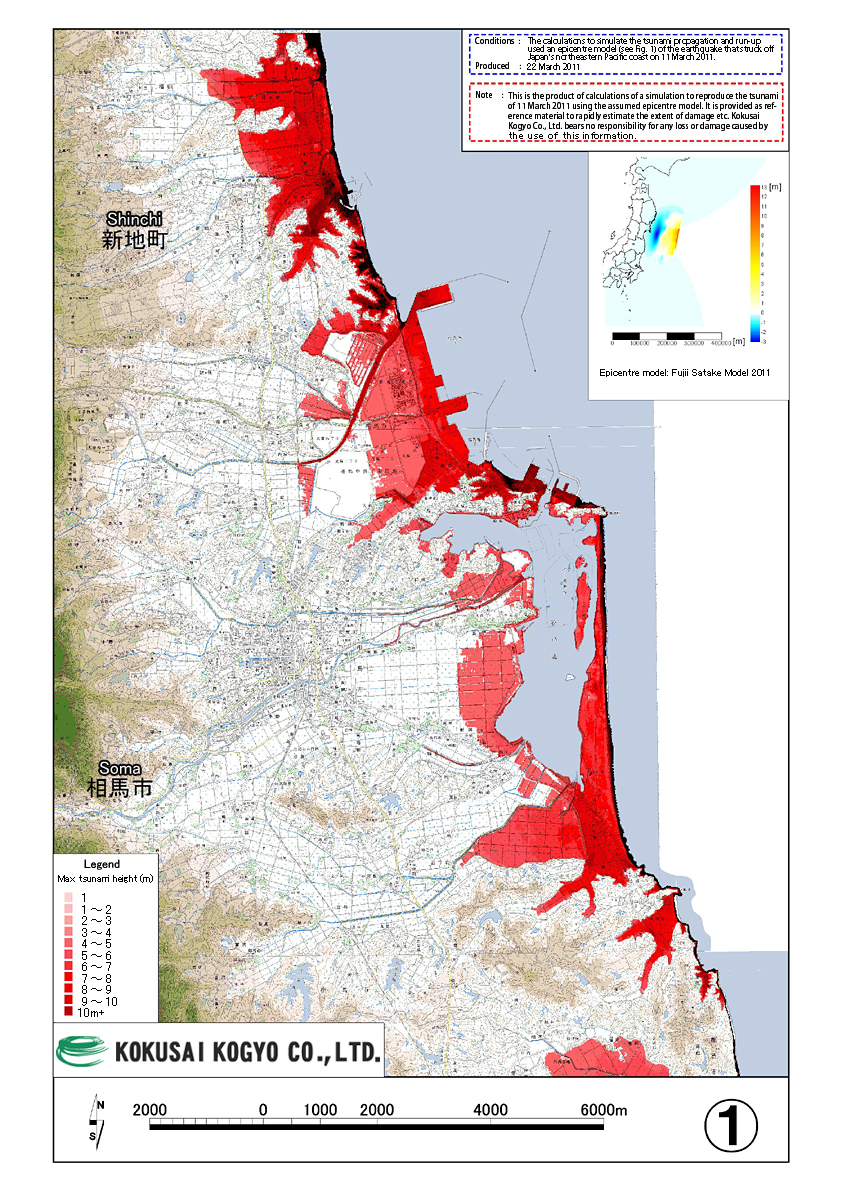
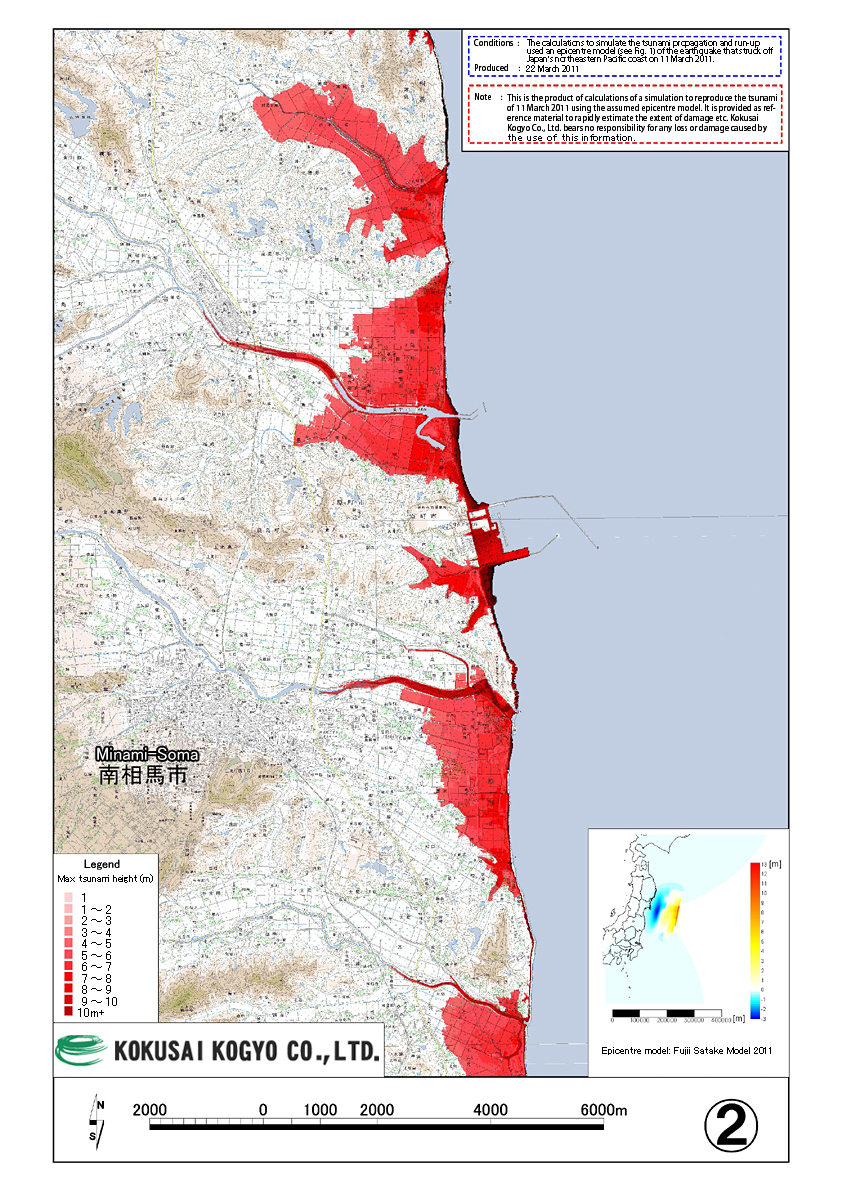
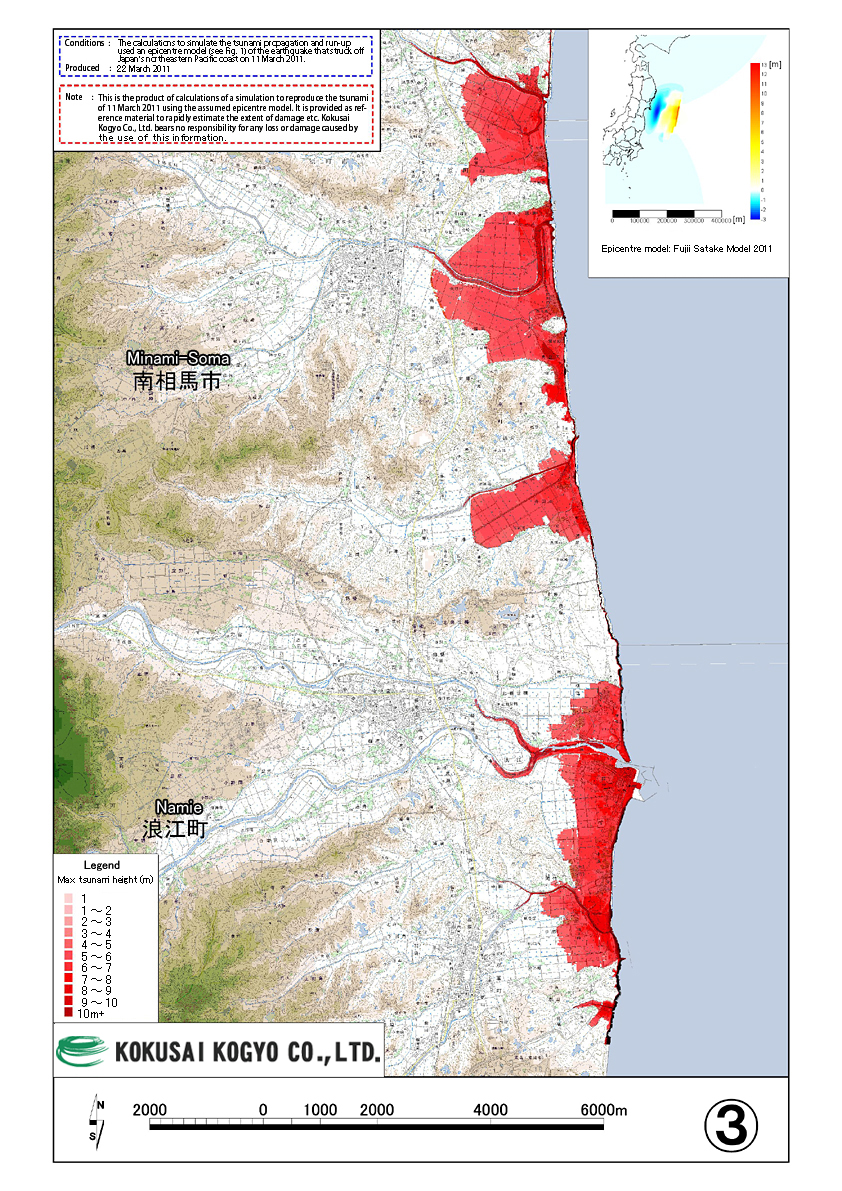
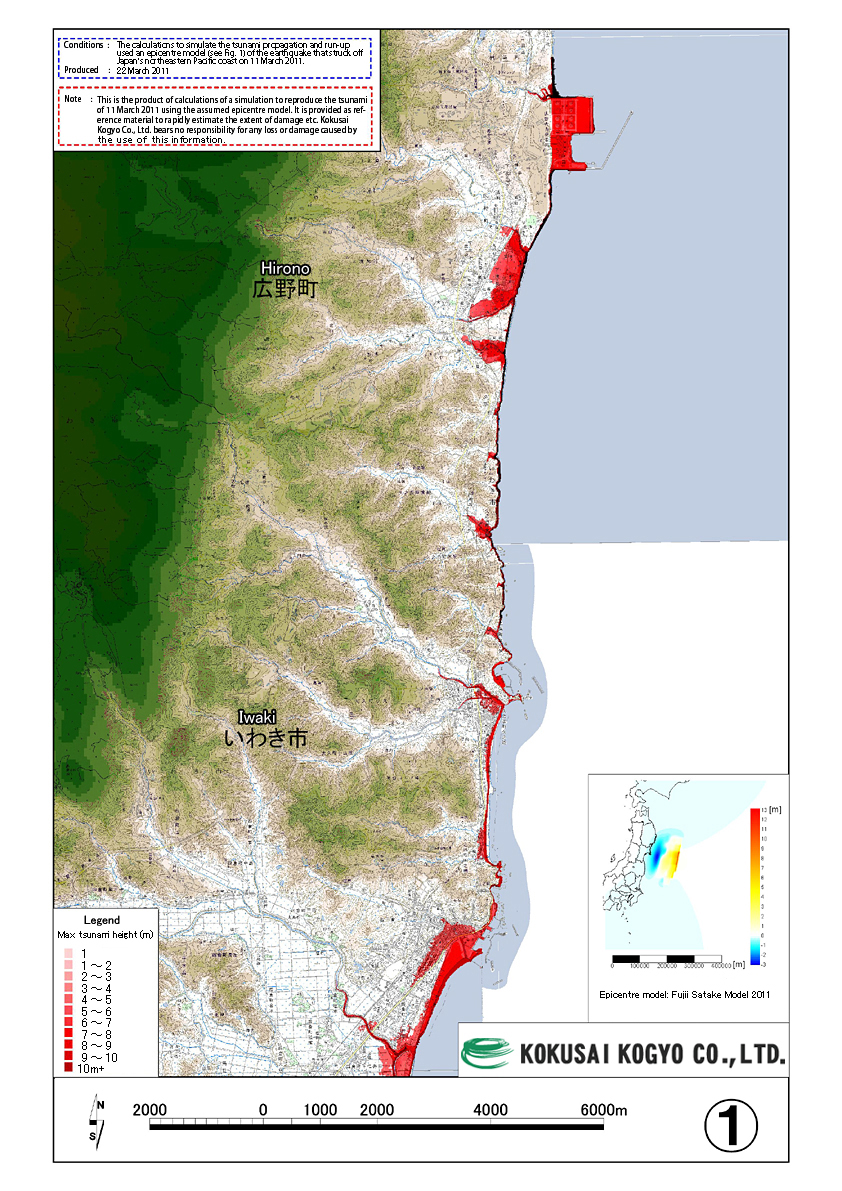
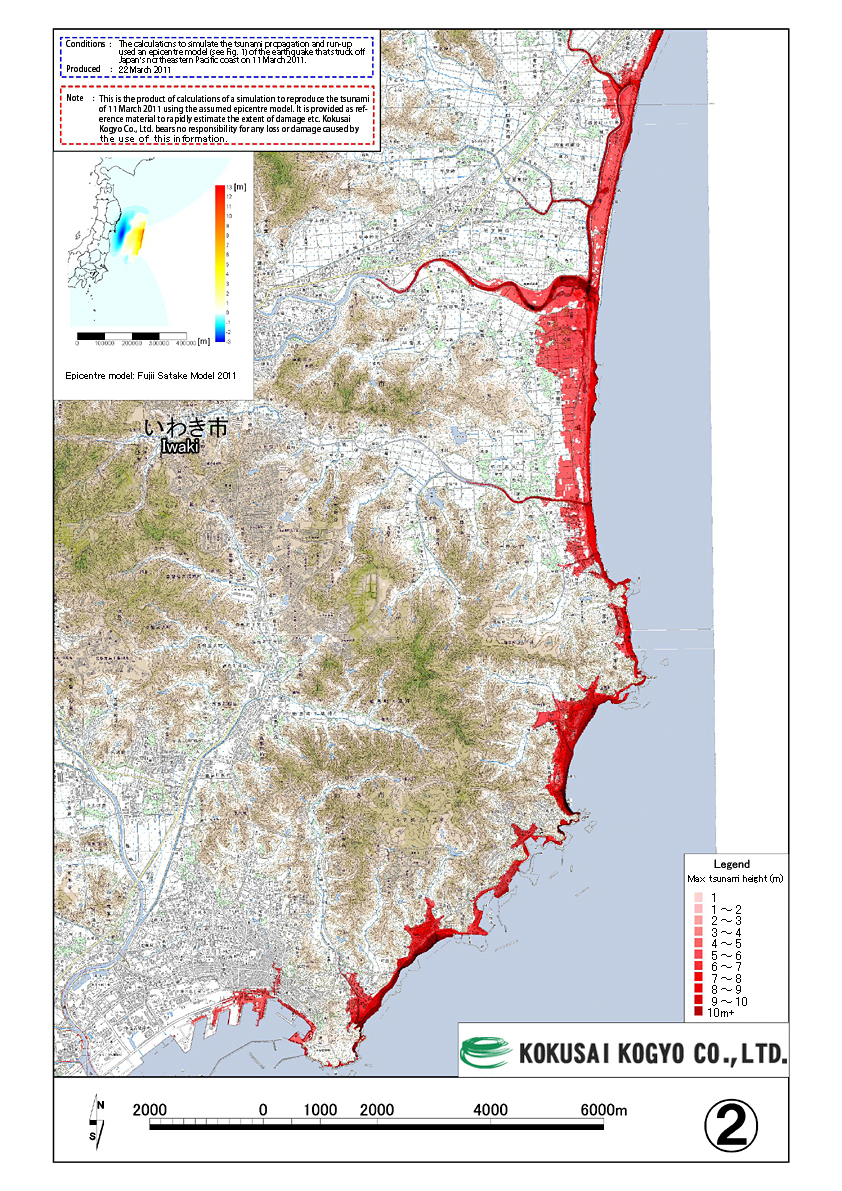
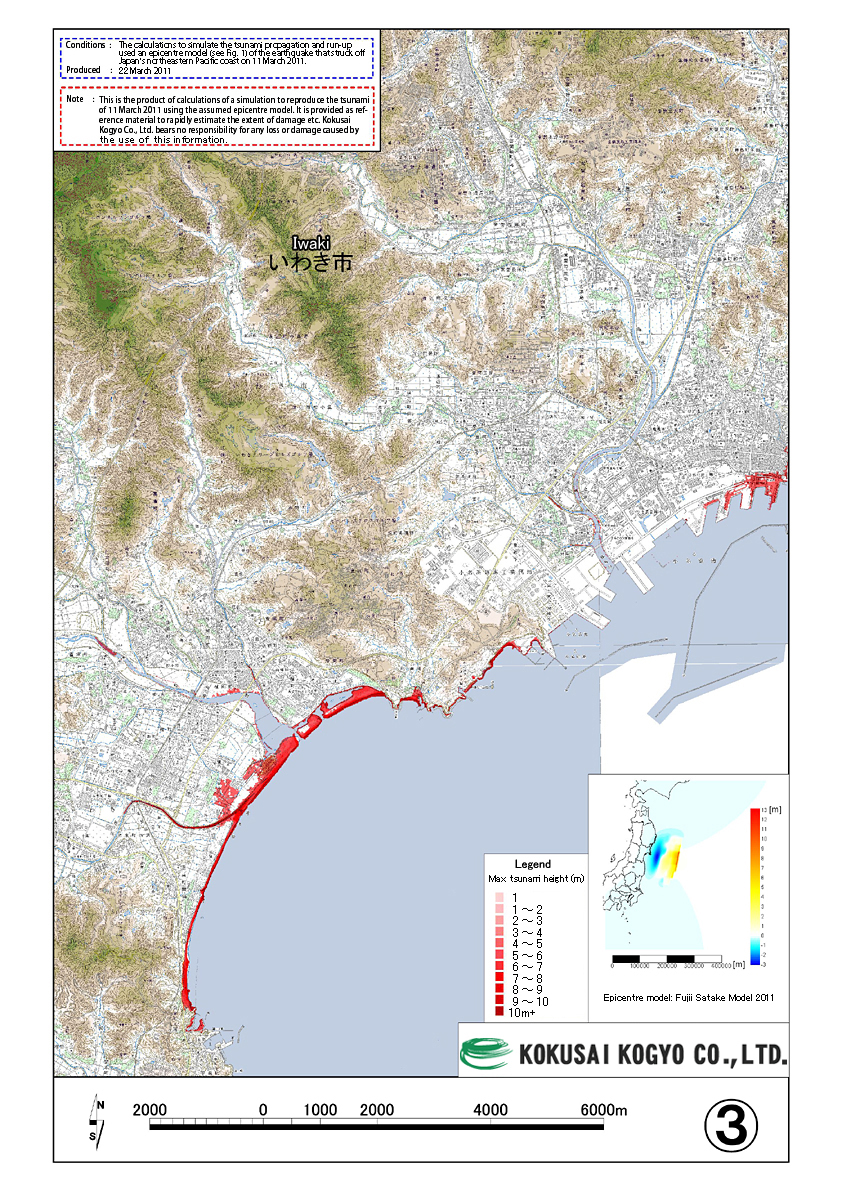
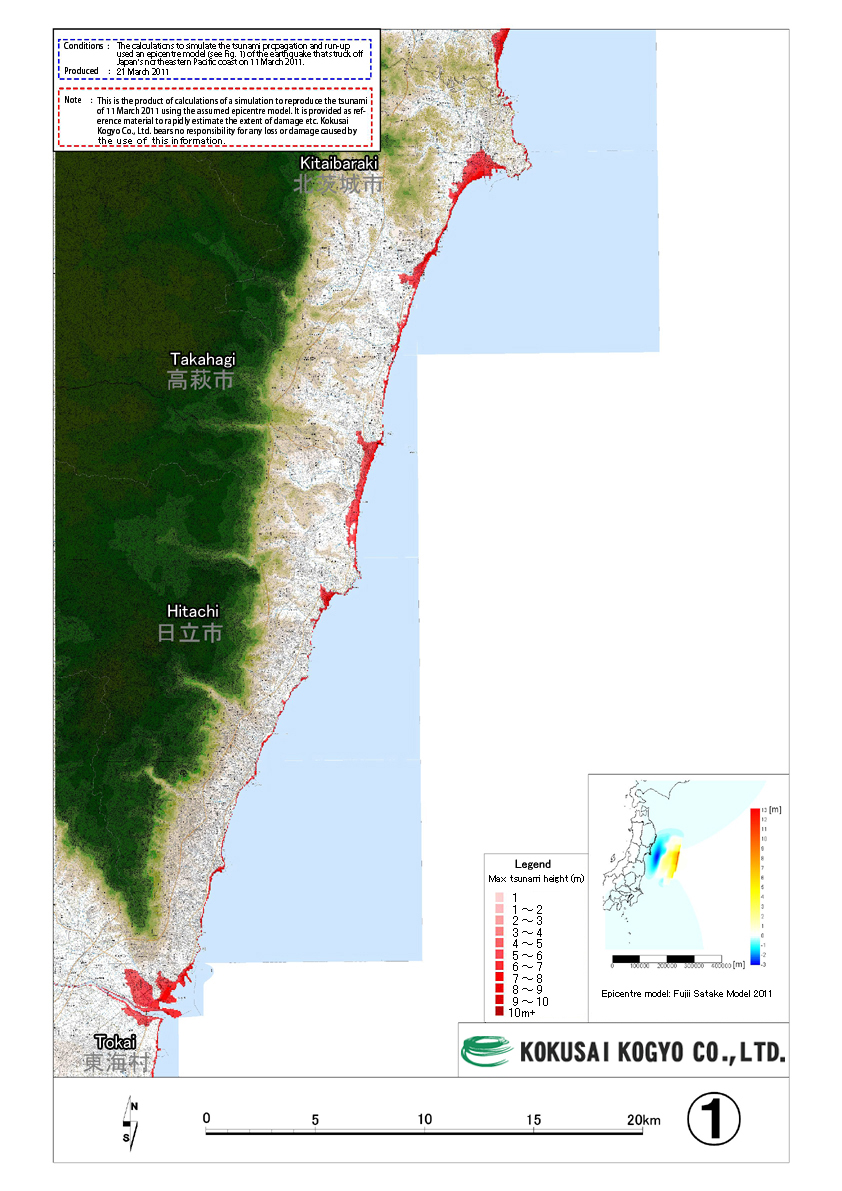
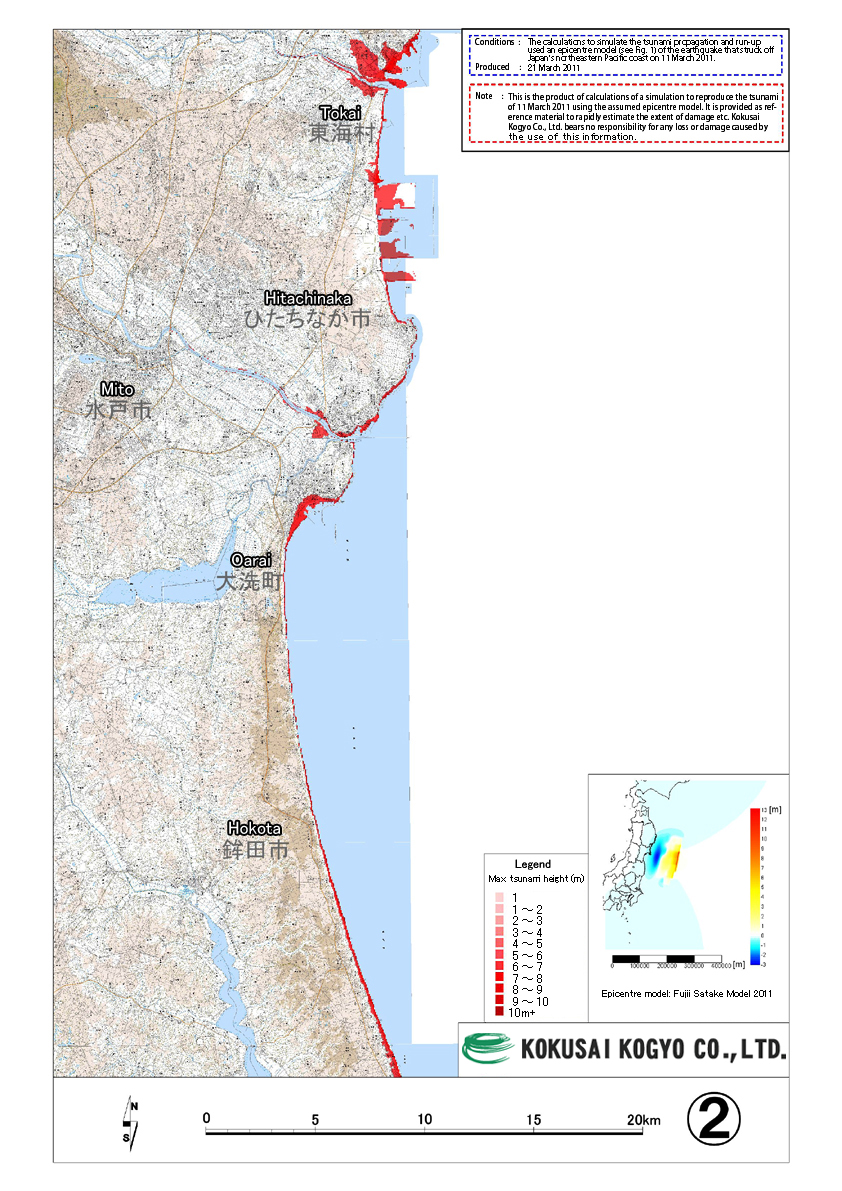
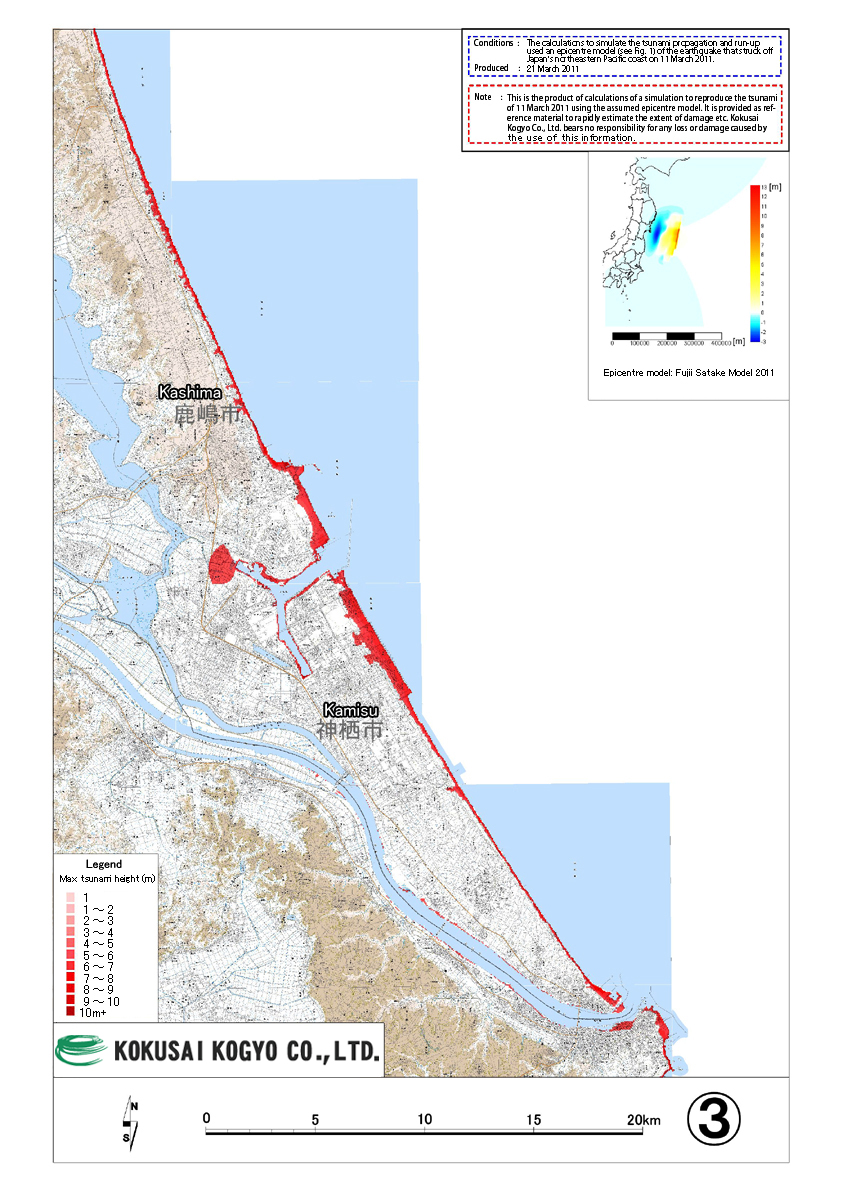
This is a computer simulation of the size of the tsunami which occurred as a result of the Great East Japan Earthquake, based on the seismic energy level as well as the topographical data of the source, the ocean floor, and the coastline.
This data provides an estimate of the scale of tsunami without having to wait for the detailed field study.
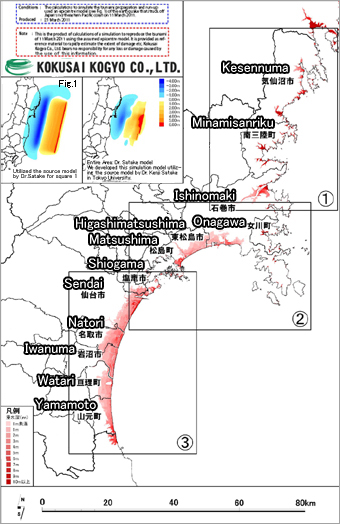
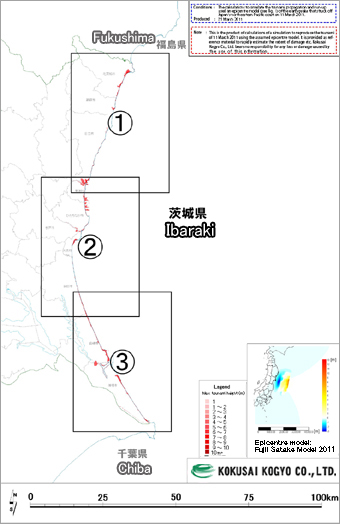
Tsunami inundation map
Using the tsunami source model for the recent earthquake, we have calculated how far the tsunami extended beyond the coastline. Click the numbered map to see the details of each area. (note: the source model used is subject to change)
| Iwate | Miyagi | Fukushima (North) | Fukushima (South) | Ibaraki |
- 1. For Fukushima, Professors Fumihiko Imamura and Shunichi Koshimura of Tohoku University (Tsunami Engineering Lab) provided the data and guidance.
- 2. For the Fukushima(South) simulation, the water level was adjusted to 70% of the original, reflecting the actual data obtained from the field study. Further research is conducted to identify the details regarding the borders of Northern and Southern Fukushima.
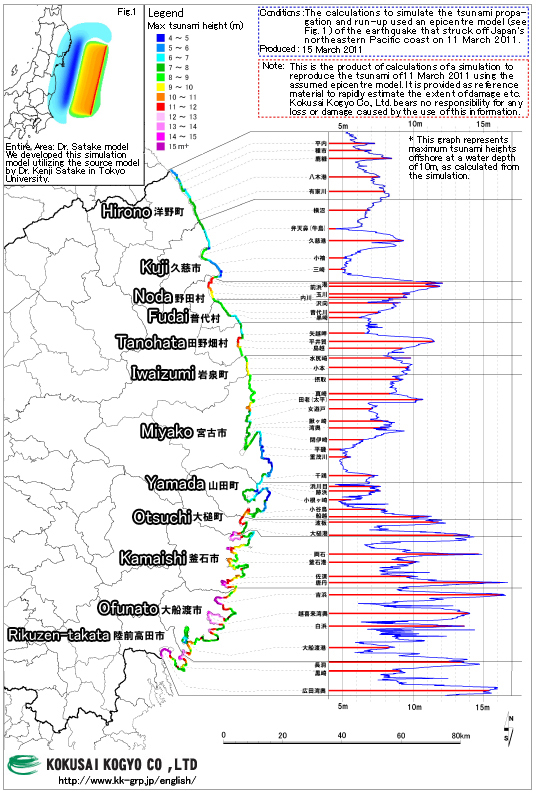
Tsunami water level map
Using the tsunami source model for the recent earthquake, we have calculated the height of the tsunami when it reached the coastline. (note: the source model is subject to change)
| Iwate | Miyagi | Northern Fukushima | Southern Fukushima |
 |
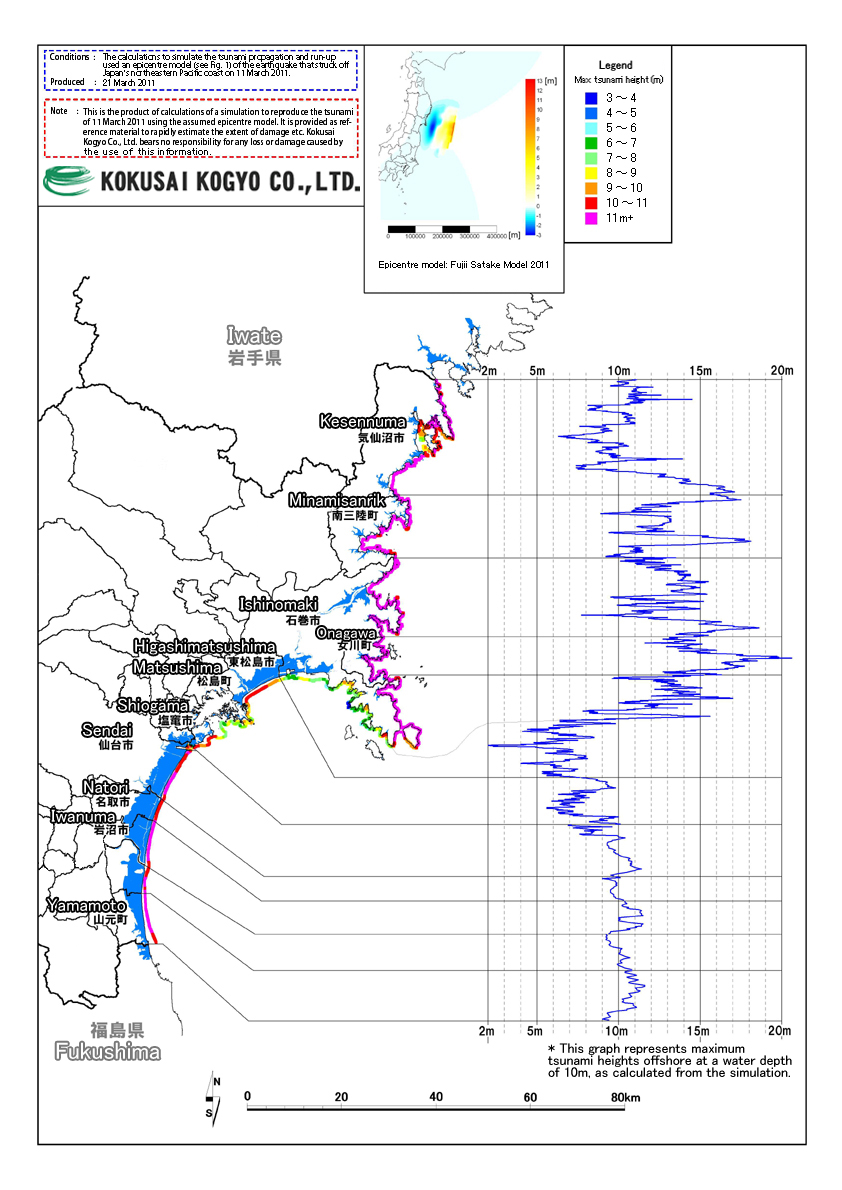 |
Note:
For the Fukushima(South) simulation, the water level was adjusted to 70% of the original, reflecting the actual data obtained from the field study. Further research is conducted to identify the details regarding the borders of Northern and Southern Fukushima.